Ocean Idea Machine · Atlasemoji
team_overview
View our Copernicus Marine hackathon submission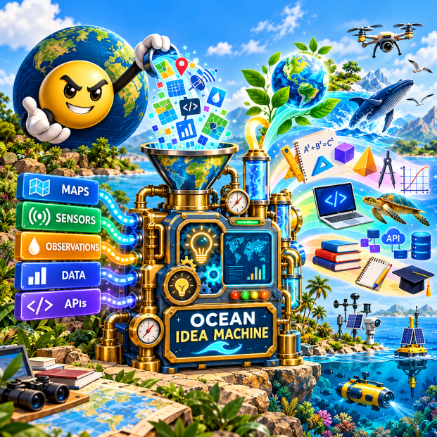
Start exploring
Summary
A shared spatial learning network that connects real-world ocean observations, Copernicus Marine data, and GIS so people of different ages and locations can observe, explore, compare, and build from the same ocean data.
One ocean, many ways to learn
A student far from the coast can start with the same ocean location as a student who lives beside it. One may watch the waves. Another may compare water temperatures, plot a chart, build a model, or write a program. They begin with the same place and choose their own path.
BuoyNet is a quick starting point: find a buoy or an area that interests you, see what is being measured, and choose what to explore first. AtlasEvo provides the map, layers, and workspace where that exploration can grow. Public buoy feeds are one part of the network, alongside observations people choose to contribute.
Description
Ocean Idea Machine uses the ocean as a living spatial classroom by connecting real observation locations with Copernicus Marine data and GIS.
Users can explore where something is happening, what surrounds it, how one location compares with another, and what changes over time. They can move from simple observation into mapping, measurement, modeling, coding, and spatial data as their interests and skills develop.
The goal is to do more than teach ocean science. It is to give people of different ages and locations access to the same real places and observations, then let them follow different educational paths from that shared starting point.
For the hackathon, we would demonstrate a small working slice of that network using selected observation locations, Copernicus Marine data, GIS context, and an interface for exploring and comparing what is happening there.
Problem
Access to ocean knowledge is uneven. Many students and communities are far from the coast, and ocean data can be difficult to understand without context.
At the same time, education is often separated into individual subjects rather than connected through real-world observation.
We want to make the ocean accessible as a common learning environment where people can explore not only what is happening, but where it is happening, how places relate, and how ocean observations connect to science, geography, mathematics, engineering, coding, and other disciplines.
Solution
Create a distributed network of ocean observation locations using cameras, sensors, contributed observations, Copernicus Marine data, and GIS.
For the hackathon, Atlasemoji is being offered as the initial network and integration layer. It already supports GIS, GeoJSON, OpenAPI, geofencing, connectors, tenant isolation, and web/mobile access.
We plan to demonstrate MAVLink, ArduPilot, and ArduSub for vehicle and station data, OpenAPI and GeoJSON for integration and spatial exchange, and ATProto and Matrix for team and community communication.
We wanted to reduce the barrier to participation. If someone already has a UAV, UUV, sensor, camera, GIS workflow, or other observation source, they should be able to connect what they have rather than start from scratch.
Each observation is tied to place and can be explored at different levels of complexity. A young child might observe waves, wildlife, weather, or human activity. Older students might measure distance, compare coastlines, examine currents, or explore change over time. More advanced learners can work directly with spatial layers, APIs, time-series data, coding, and analysis.
The same network can therefore support different ages, locations, disciplines, and ways of contributing.
A buoy network we can learn from
We can also learn from buoys and coastal weather stations that already publish data. BuoyNet is one data source for Ocean Idea Machine. It currently brings NOAA NDBC station locations and available weather and wave readings into Atlasemoji.
Use BuoyNet to find a station, read its data, or download it for research. In AtlasEvo, choose Data → BuoyNet to add buoy locations to your map. Select a buoy to see its available readings and save them to your workspace.
These public feeds give students real observations to study alongside future contributions from phones, cameras, sensors, UAVs, and underwater vehicles. Each source keeps its name, time, location, and units. Missing instrument details and depth stay marked as unknown.
Connecting different observations
A common data model has been proposed for observation nodes that can work with different kinds of hardware. The goal is to bring readings from public feeds and contributed stations into one shared structure that others can use. A simple sensor, a professional buoy, a UAV, or an underwater vehicle should be able to describe its observations in the same clear way.
That structure records the sensor identity, calibration, time, position, uncertainty, and health and quality indicators. It keeps the original source and meaning of each reading. Different formats need adapters into this model; sharing a feed does not yet combine it automatically with all other data.
A second proposed step is to compare readings with nearby stations and Copernicus Marine reference data. This could help explain a reading’s quality rather than simply accept or reject it. These comparisons are planned work, not a running service today.
Our aim is a shared set of observations that students, researchers, and other applications can explore through maps, downloads, and documented APIs. Contributors must choose what they share; private workspace data stays under its existing access controls.
What works now, and what comes next
BuoyNet provides NOAA station data and AtlasEvo map imports. Connecting other networks and vehicle formats, adding Copernicus data layers, and comparing measurements are next steps.
private_data